The Historical Cost of Housing: Real Estate Value Over the Decades
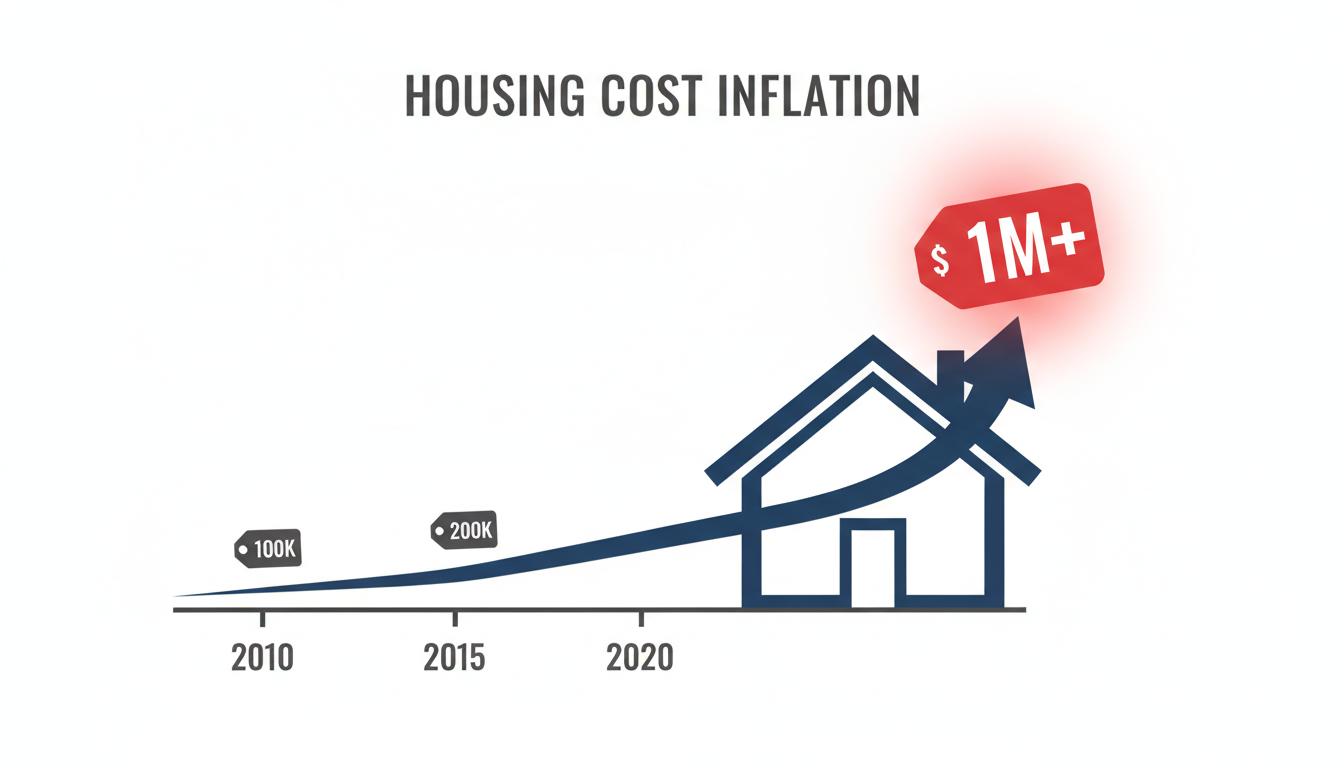
The dream of owning a home has long been a cornerstone of American life, but for many, it feels more like a distant fantasy than an achievable goal. Over the past several decades, the historical cost of housing has skyrocketed, creating a landscape where property values have dramatically outpaced both wage growth and general inflation. This shift has fundamentally altered the financial reality for millions of families across the country.
In short, while paychecks have grown, the price tags on homes have grown exponentially faster, stretching budgets and redefining what it means to be a homeowner. Understanding this trend requires looking back at the numbers, which tell a clear story of declining affordability and the changing nature of historical purchasing power over time.
Average House Price 1970 vs. Today: A Startling Contrast
The difference in home prices between the 1970s and today is perhaps the most direct illustration of the affordability crisis. The raw numbers show an astronomical leap that has reshaped the American real estate market and the financial lives of its participants.
In 1970, the median price for a home in the United States was between $17,000 and $25,000 (not adjusted for inflation). Fast forward to 2025, and that figure has exploded. According to data from the Federal Reserve and the U.S. Census Bureau, the typical median home price now stands between $410,800 and $416,900.
This represents an increase of well over 1,500% since the late 1960s. The figures for new construction are even higher, with the average sales price of new homes exceeding $520,000 in August 2025, underscoring the rising costs of land, labor, and materials.
The Story of Housing Price Inflation History
While inflation affects the price of everything, from groceries to gasoline, the historical cost of housing has followed a unique and much steeper trajectory. For decades, the value of real estate has not just kept up with inflation—it has consistently and significantly surpassed it, widening the gap between income and the price of shelter.
Home Prices vs. General Inflation (CPI)
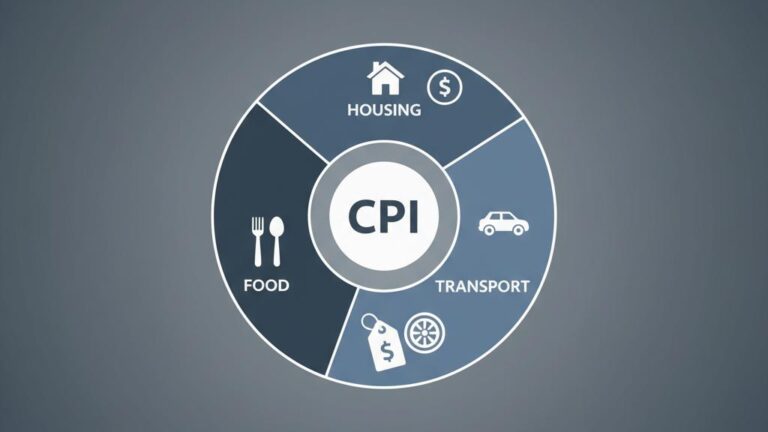
Over the last five decades, the data is unambiguous. From 1967 to 2025, U.S. housing prices have grown by more than 1,500%. During that same period, the general Consumer Price Index (CPI), which measures the average change in prices paid by urban consumers for a market basket of consumer goods and services, increased by approximately 900%. Understanding how to analyze these figures is crucial, and it often involves using CPI to adjust historical values for an accurate comparison.
The Widening Gap Between Income and Home Values
Even more concerning is the divergence between home prices and household income. This trend highlights the core of the affordability challenge. While Americans are earning more than they did in previous generations, their income has not kept pace with the soaring cost of real estate.
- From 1985 to 2025, the median home price rose by 403%.
- During the same 40-year period, the median household income increased by only 252%.
This disparity means that the financial burden of purchasing a home has grown substantially, forcing buyers to dedicate a much larger portion of their income to housing than their parents or grandparents did.
Declining Purchasing Power: Housing Affordability Metrics
To truly grasp the erosion of purchasing power housing, experts rely on key metrics that compare home prices to income. The most widely used is the home price-to-income ratio, which provides a clear snapshot of how affordable housing is for the average household.
Nationally, this ratio has climbed from a manageable 3.5 in 1985 to 5.0 in 2025. This means that today, the median home costs five times the median annual household income. In many major metropolitan areas, the situation is far more extreme.
- In Los Angeles, the median home costs 12.5 times the area’s median income.
- Major tech hubs and coastal cities like San Jose and New York City report similarly elevated and challenging ratios.
The Role of Mortgage Rates
One factor that has partially offset the surge in home prices is the long-term decline in mortgage interest rates. In 1985, homebuyers faced daunting rates around 12.4%. By 2025, rates had moderated to around 6.8%, after hitting historic lows during the pandemic.
While lower rates reduce monthly payments and make borrowing more accessible, they have not been enough to counteract the massive increase in principal home values. The total cost of homeownership, driven by the initial purchase price, remains a significant barrier for many.
Recent Trends and Stark Regional Differences
The U.S. housing market is not a monolith; it is a complex tapestry of diverse regional markets, each with its own dynamics. The last few years, marked by the COVID-19 pandemic, the rise of remote work, and volatile interest rates, have amplified these differences.
Nationally, the rapid price appreciation seen during the pandemic has slowed. Between the second quarter of 2024 and 2025, U.S. house prices rose by a modest 2.9%. However, this national average masks significant regional variations:
- The Middle Atlantic region saw a robust 6.7% annual price increase.
- In contrast, the Pacific division, which includes high-cost states like California, lagged behind with growth under 1%.
California serves as a potent case study. From January 2020 to September 2025, the average monthly payment for a mid-tier home in the state skyrocketed by 74%. This far outpaced both wage growth (25%) and rent increases (42%) over the same period, creating an acute affordability crisis.
Key Factors Driving the Historical Cost of Housing
The dramatic rise in U.S. housing costs is not the result of a single cause but rather an interplay of several powerful economic and social forces. These factors have combined to create a market defined by high demand and constrained supply.
- Supply Constraints: Restrictive zoning laws and extensive regulatory practices in many cities limit the construction of new housing, especially affordable, dense housing. This artificial cap on supply ensures prices remain high when demand is strong.
- Population Growth and Urbanization: A steadily growing population and a multi-decade trend of people moving to major urban centers for jobs have concentrated demand in specific geographic areas.
- Fluctuations in Mortgage Interest Rates: Decades of generally falling interest rates, culminating in the historic lows of the pandemic era, made borrowing cheaper and fueled intense buyer demand.
- Increasing Building Costs: The costs of construction materials and skilled labor have risen significantly, making it more expensive to build new homes, which in turn pushes up the price of the final product.
- Investment and Speculative Demand: Real estate is increasingly treated as a financial asset. Demand from institutional investors and speculative buyers can crowd out traditional homebuyers and drive up prices.
These drivers have created a feedback loop where limited supply and high demand continually push the historical cost of housing further upward, particularly impacting first-time buyers and lower-income families.
Frequently Asked Questions
How much has the average U.S. house price increased since 1970?
The average U.S. house price has risen by over 1,500% since 1970. The median price grew from approximately $17,000–$25,000 in 1970 to over $410,000 by 2025.
Have home prices increased faster than wages?
Yes, home prices have consistently outpaced wage growth for decades. From 1985 to 2025, median home prices grew 403%, while median household incomes rose only 252%, significantly worsening affordability.
How do today’s mortgage rates compare to historical rates?
Mortgage rates today are much lower than in previous eras. They have fallen from highs of around 12.4% in the mid-1980s to approximately 6.8% in 2025, which has helped make borrowing cheaper but has not been enough to offset the rapid rise in home prices.
Why has housing become so much less affordable?
Housing has become less affordable due to a combination of factors, including chronic housing supply shortages, strong and persistent demand, rising construction costs, investment buying, and wage growth that has failed to keep pace with price appreciation.
Conclusion: A New Chapter in American Homeownership
The data on the historical cost of housing paints a clear picture: over the past 50 years, the dream of homeownership has become mathematically more difficult for the average American to achieve. The dramatic decoupling of home prices from wages and inflation has created significant financial hurdles, particularly for younger generations and first-time buyers.
This long-term trend, driven by a complex mix of supply constraints, economic policies, and demographic shifts, continues to shape the nation’s economic landscape. As we look forward, addressing the housing affordability crisis remains one of the most pressing challenges of our time, directly impacting the financial stability and historical purchasing power parity of millions of households.