Historical Commodity Prices: Oil, Wheat, and the Cost of Living
From the price you pay at the gas pump to the cost of a loaf of bread, the value of raw materials shapes our daily lives. Understanding historical commodity prices provides a fascinating window into global economics, revealing the powerful forces of war, technology, and human innovation that have defined the last century.
By charting the fluctuations of essential goods like oil, wheat, and metals, we can see more than just numbers; we see a story of booms, busts, and the ever-changing real value of the world’s most fundamental resources. This article explores the dramatic history of key commodity prices, how they relate to the cost of living, and what their inflation-adjusted trends tell us about our economic past and future.
What Are Historical Commodity Prices?
Commodity prices refer to the market cost of raw materials or primary agricultural products. These are the basic goods that form the foundation of our global economy, and they typically fall into three main categories:
- Energy: Crude oil, natural gas, and coal.
- Metals: Copper, steel, gold, and iron.
- Agricultural Products: Wheat, corn, soybeans, and coffee.
When analyzing these prices over long periods, economists use two different lenses:
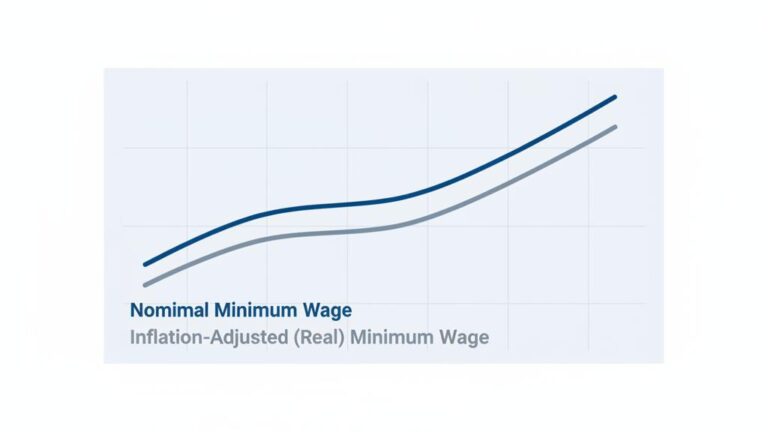
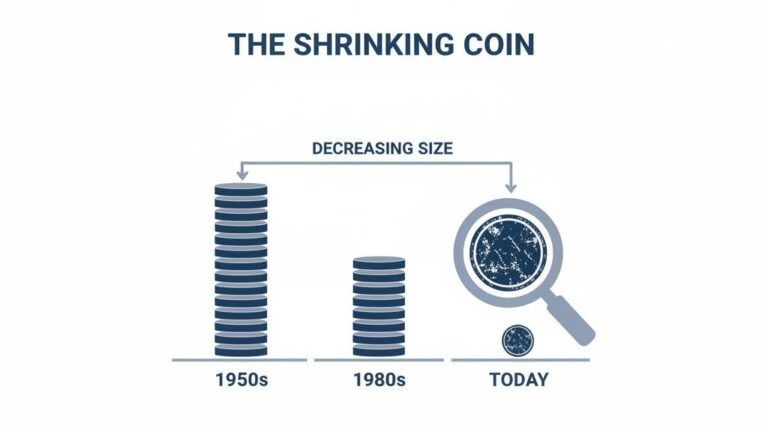
Nominal prices represent the price of a commodity in the currency of the day. While simple to look at, nominal prices can be misleading because they don’t account for inflation. A dollar in 1950 had far more buying power than a dollar today.
Real prices are adjusted for inflation, showing the cost of a commodity in constant dollars from a specific base year. This method strips away the effects of currency devaluation and gives us a truer understanding of a commodity’s value relative to other goods and services, revealing its historical purchasing power over time.
The Volatile Oil Price History, Inflation Adjusted
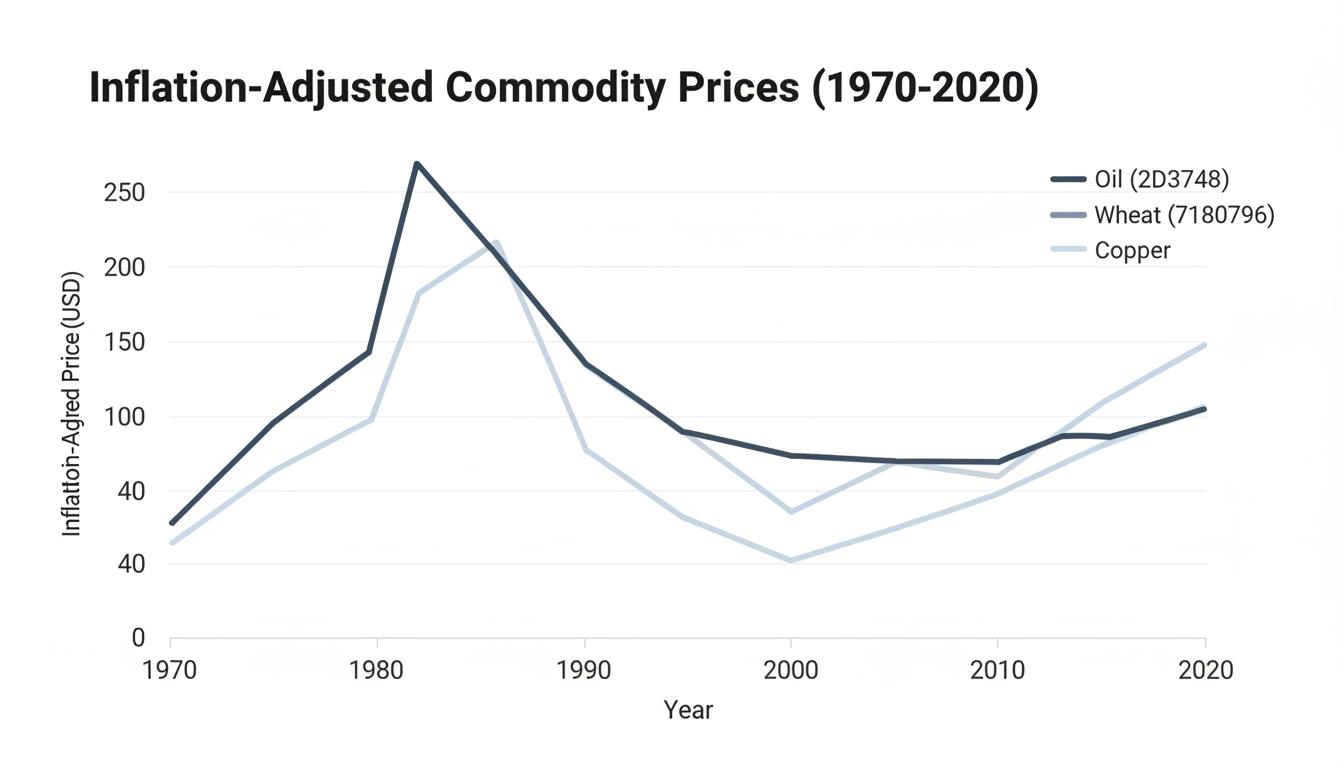
No commodity is more sensitive to political and economic shifts than oil. Its price history is marked by long stretches of calm punctuated by sudden, violent spikes that reverberate through the global economy. An inflation-adjusted view reveals just how dramatic these shifts have been.
Pre-1970s: An Era of Stability
For much of the mid-20th century, real oil prices remained remarkably low and stable. Abundant supply from the United States and emerging Middle Eastern producers, combined with limited influence from the newly formed OPEC, kept energy affordable and predictable, fueling post-war economic expansion.
The 1970s Oil Shocks: A New Reality
This stability shattered in the 1970s. Two major geopolitical events sent real oil prices soaring to unprecedented heights:
- 1973 Yom Kippur War: An OPEC oil embargo against nations that supported Israel caused the first major oil shock, quadrupling prices.
- 1979 Iranian Revolution: The overthrow of the Shah of Iran removed a major producer from the market, triggering a second, even more severe price spike.
These events plunged the world into an energy crisis, highlighting the West’s dependence on foreign oil and ushering in an era of inflation and economic stagnation.
The Late 20th Century: Prices Retreat
From the mid-1980s through the 1990s, real oil prices fell back significantly. This was driven by a combination of factors, including increased production from non-OPEC countries, greater energy efficiency in vehicles and industry, and a general supply glut.
The 21st Century: Renewed Volatility
The 2000s saw prices surge once again. Rising demand from rapidly industrializing China, coupled with Middle Eastern conflicts and financial speculation, pushed real oil prices back to levels that rivaled or even surpassed the peaks of the 1970s. This period was followed by continued volatility, including a sharp crash in late 2014 and another historic plunge during the 2020 COVID-19 pandemic.
A Look at Wheat Price History in the 1900s
As a staple food for billions, wheat offers a different but equally important economic story. Its historical price patterns reflect agricultural productivity, global trade policies, and the impact of major world events.
The journey of wheat prices over the last century includes several key phases:
- Early 1900s: Prices were highly sensitive to weather, the disruptions of World War I, and the expansion of transportation networks like railroads.
- The Great Depression: A combination of overproduction and total economic collapse caused wheat prices to plummet, devastating farming communities.
- Post-WWII: The market saw a gradual recovery with moderate price increases driven by rebuilding efforts and a growing global population.
- 1970s–Present: The integration of global markets and the energy shocks of the 70s brought renewed volatility. In recent decades, prices have experienced wide swings due to climate change, supply chain disruptions, and trade disputes.
Despite these periods of volatility, the most significant trend in the real value of raw goods like wheat is a long-term decline. Adjusted for inflation, the price of wheat has generally fallen over the 20th and 21st centuries. This remarkable trend is a direct result of technological progress, including mechanization, improved fertilizers, and higher-yield crop varieties that have massively increased supply.
Commodity Prices vs. Cost of Living: A Complex Relationship
The price of raw materials is a critical component of the overall cost of living, which is officially measured by the Consumer Price Index (CPI). When commodity prices rise, the effect eventually trickles down to consumers, but the relationship isn’t always direct or immediate.
Direct and Indirect Effects
The connection is most obvious in certain sectors. Higher oil prices lead directly to more expensive gasoline and heating fuel. Higher wheat prices increase the cost of bread, pasta, and other food products. These are direct effects that consumers feel quickly.
However, there are also powerful indirect effects and mitigating factors. Technological innovation allows manufacturers to substitute cheaper materials or develop more efficient processes. A diversified modern economy means that the cost of raw materials is only one part of the final price of a consumer good, which also includes labor, marketing, and transportation.
For these reasons, the CPI is typically much less volatile than commodity price indices. While a sudden oil shock can cause a spike in the CPI, the overall cost of living tends to rise more slowly and steadily. Understanding this dynamic is key for anyone using CPI data to adjust historical values for accurate analysis.
Where to Find Reliable Historical Commodity Prices Data
For researchers, economists, and curious individuals, several authoritative institutions provide high-quality data on historical prices. These sources are essential for trustworthy analysis:
- U.S. Bureau of Labor Statistics (BLS): Offers extensive data on the Consumer Price Index (CPI) and Producer Price Index (PPI).
- Federal Reserve Economic Data (FRED): A comprehensive database from the St. Louis Fed, including the benchmark Producer Price Index for All Commodities, with data from 1913.
- International Monetary Fund (IMF): Provides global commodity price data, crucial for international comparisons and understanding historical purchasing power parity.
- United States Department of Agriculture (USDA): The primary source for historical and current data on agricultural commodities like wheat and corn.
Summary Table: Nominal vs. Real Price Changes (1935–2025)
| Commodity | Nominal Trend | Real (Inflation-Adjusted) Trend | Key Events |
|---|---|---|---|
| Oil | Strongly Upward (↑↑) | Upward but highly volatile (↑) | Oil shocks, wars, technology, global demand |
| Wheat | Upward (↑) | Downward long-term (↓) | Wars, weather events, farming technology |
| Metals | Strongly Upward (↑↑) | Stable to downward (↔/↓) | Industrialization, global growth, new discoveries |
Conclusion: The Enduring Story of Raw Materials
The study of historical commodity prices reveals a world shaped by constant change. While nominal prices for nearly all raw materials have risen over the last century—with an average annual commodity inflation rate of 3.06% between 1935 and 2025—the real story is one of volatility and innovation.
Energy remains uniquely vulnerable to geopolitical shocks, creating economic waves that affect everyone. In contrast, many other commodities, particularly agricultural ones, have become cheaper in real terms due to human ingenuity. By looking past the headlines and adjusting for inflation, we gain a deeper appreciation for the economic forces that have defined our past and will continue to shape our future.
Frequently Asked Questions
What are historical commodity prices and why are they important?
Historical commodity prices are records of how the value of raw materials like oil, wheat, and metals have changed over time. They provide critical insight into economic health, inflation, geopolitical events, and long-term market cycles.
How do oil prices adjusted for inflation compare across decades?
Inflation-adjusted oil prices show that the real cost peaked during the 1970s oil shocks and also approached similar levels in the 2000s. These records highlight extreme volatility in response to global crises, unlike the relatively stable prices of the mid-20th century.
What is the relationship between commodity prices and the cost of living?
Commodity prices directly affect the cost of living, as measured by the Consumer Price Index (CPI), by influencing the cost of energy, food, and manufactured goods. However, this impact is often moderated by technological change, economic diversification, and other factors, making the CPI less volatile than raw commodity prices.
Why have real prices for commodities like wheat tended to fall over the long term?
Long-term declines in the real prices for commodities like wheat are mostly due to massive improvements in farming technology, higher crop yields, and more efficient global trade. These factors have allowed supply to grow faster than demand, reducing the inflation-adjusted cost over many decades.
Where can I find historical data on commodity prices and inflation?
Authoritative sources for historical economic data include the U.S. Bureau of Labor Statistics (BLS), the International Monetary Fund (IMF), Federal Reserve Economic Data (FRED), and the United States Department of Agriculture (USDA).