Adjusting Historical Wages and Salaries for Inflation
Have you ever heard that the average salary in the 1950s was only about $3,300 a year and wondered how anyone could possibly live on that? While that number sounds incredibly low today, it doesn’t tell the whole story. The secret to making sense of historical earnings lies in a crucial economic process: adjusting historical wages for inflation.
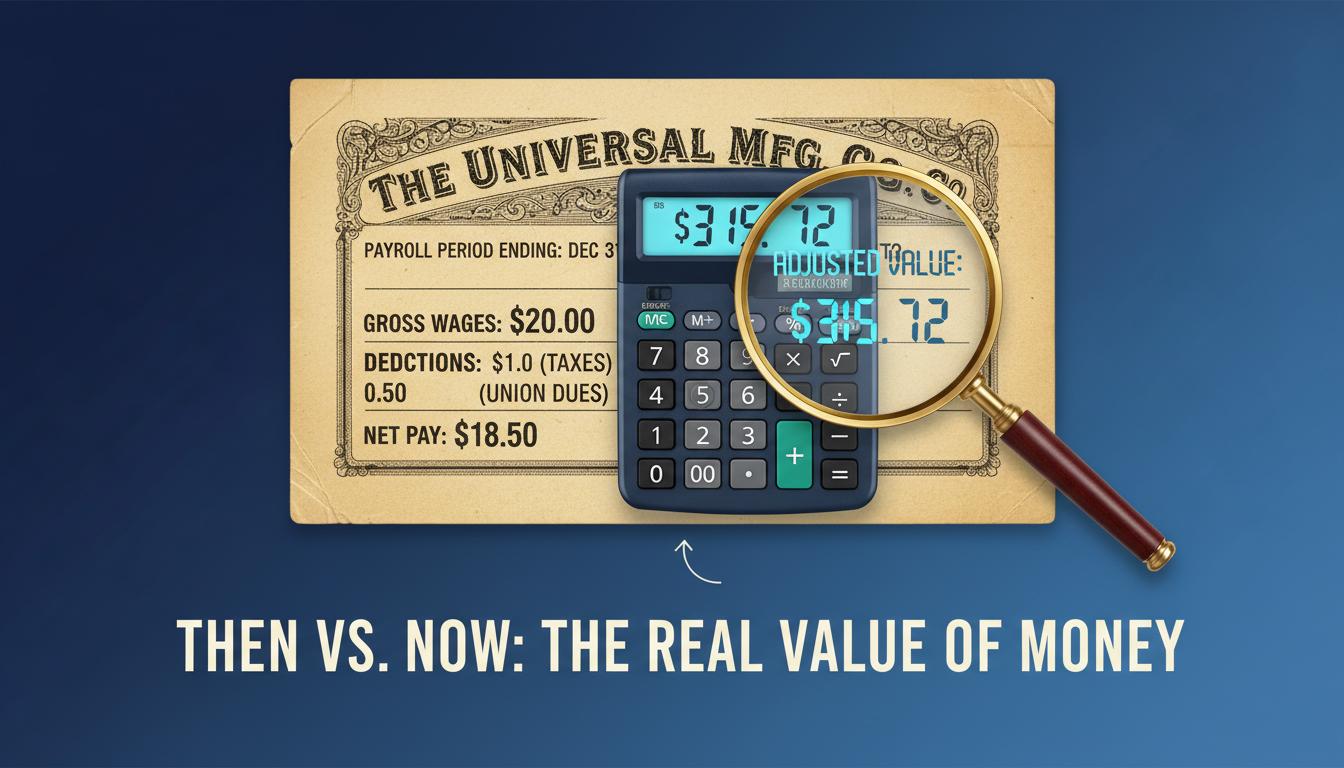
This adjustment allows us to look beyond the face value of money—the nominal wage—and understand its true purchasing power, or real wage, across different time periods. It answers the fundamental question: Did people in the past actually have more or less buying power with their paychecks than we do today? Understanding this difference is key to accurately assessing economic progress and living standards over time.
Why Adjusting Wages for Inflation is Crucial
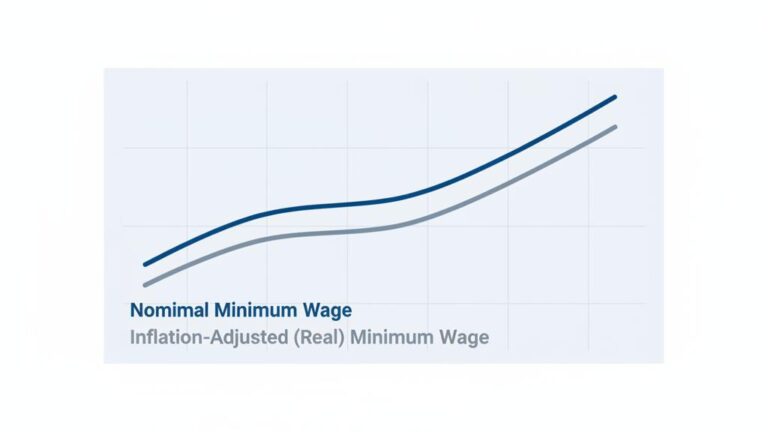
To have a meaningful conversation about wages over time, we must first understand two key concepts: nominal wages and real wages. Without this distinction, historical comparisons are misleading.
- Nominal Wages: This is the actual dollar amount you receive in your paycheck at the time you earn it. A $3,300 salary in 1950 is a nominal wage.
- Real Wages: This is the value of your earnings after accounting for inflation. It reflects the true purchasing power of your money in terms of the goods and services you can buy.
The primary reason for this distinction is inflation—the rate at which the general price of goods and services rises, eroding the purchasing power of money. When wages don’t keep up with inflation, workers are effectively getting a pay cut, even if their nominal salary stays the same or increases slightly.
A stark example can be seen in U.S. wage data from March 2006 to July 2024. During this period, nominal average weekly wages grew by an impressive 82.3%, from $686 to $1,250. However, once adjusted for inflation, the real wage growth was a much more modest 12.7%, an increase of only $141. This shows how inflation consumed the vast majority of the apparent pay raise.
The Key Tools for Adjustment: CPI and ECI
Economists and policymakers rely on specific indexes to measure inflation and make these critical adjustments. The most important of these is the Consumer Price Index (CPI).
The Consumer Price Index (CPI): The Gold Standard
The Consumer Price Index (CPI) is the most widely used metric for tracking inflation’s impact on wages. Published by the Bureau of Labor Statistics (BLS), the CPI measures the average change over time in the prices paid by urban consumers for a market basket of consumer goods and services.
Because it reflects the cost of living for the average person, it’s the standard tool for converting historical dollar values into their present-day equivalents. This process, known as indexing, is so vital that it’s often written into legislation. For example, annual adjustments to Social Security benefits are directly tied to CPI changes to ensure recipients maintain their purchasing power. For a deeper dive, learn more about using the CPI to adjust historical values.
Other Measures: ECI and PCE
While the CPI is the most common tool, other indices provide different perspectives:
- Employment Cost Index (ECI): The ECI specializes in tracking changes in labor costs for a fixed set of occupations. Its unique advantage is that it isolates wage changes from shifts in the labor force, such as a large number of low-wage jobs being added, which can skew average wage data.
- Personal Consumption Expenditures (PCE) Price Index: The PCE is another inflation measure that is sometimes used. While both are valuable, the CPI remains the most common for direct wage and labor comparisons.
How to Calculate Real Earnings from Historical Wages
Adjusting a historical salary to its modern-day equivalent is a straightforward process once you have the right data. You can easily find historical CPI data from government sources like the BLS or through economic data platforms like FRED (Federal Reserve Economic Data).
Here is the simple, step-by-step method for calculating real earnings:
- Find the Nominal Wage: Start with the original salary or wage from the historical period (e.g., $3,300 in 1950).
- Get the CPI Values: You need two CPI values: one for the historical year (the “historic year”) and one for the year you want to compare it to (the “comparison year,” usually the present).
- Apply the Formula: Use the following equation to find the real wage in today’s dollars.
The core formula is:
Real Wage (in comparison year dollars) = Nominal Wage × (CPI of comparison year ÷ CPI of historic year)
This calculation reveals the true historical purchasing power of past earnings, allowing for an accurate, apples-to-apples comparison.
A Historical Look: Real Wage Growth History
Applying this formula to historical data reveals fascinating trends about worker prosperity over the decades. The story is often more complex than the steady upward climb that nominal wages suggest.
Average Salary 1950s vs Today
Let’s return to the 1950s. The average annual salary was around $3,300-$3,800, and the federal minimum wage was just $0.75 per hour in 1950. When adjusted for inflation, that minimum wage is equivalent to about $9.20 per hour today.
Interestingly, the real value of the federal minimum wage has not steadily increased. It actually peaked in 1968, reaching a level of purchasing power well above the current federal minimum of $7.25. This shows that despite nominal increases over the years, the minimum wage’s ability to cover essential costs has declined significantly.
Periods of High Inflation: The 1980s Case Study
Periods of high inflation can be devastating for workers. In the early 1980s, high inflation created a scenario where large pay raises were actually pay cuts. Nominal wage increases, as measured by the ECI, were over 9% per year.
However, inflation was higher in some years. The result was a decline in real wages of about 5%, meaning workers’ paychecks could buy significantly less than the year before despite the hefty nominal raise.
Long-Term Trends and Worker Prosperity
Over the long run, real wages have generally increased, leading to higher living standards. For example, a study of the UK from 1750 to 2015 found that while nominal wages rose 1,695-fold, prices rose 152-fold. The result was an 11.2-fold increase in real wages, meaning what took a year’s salary to buy in 1750 could be purchased with just over a month’s earnings in 2015.
However, growth can be inconsistent. In the U.S., average real wages remained relatively flat from 2005 through 2013, indicating that for nearly a decade, earnings barely kept pace with the rising cost of living. Understanding these trends requires looking beyond borders at metrics like historical purchasing power parity (PPP) to see how different economies compare.
Understanding the Wage vs. CPI History
The relationship between wage growth and CPI changes is central to understanding economic well-being. When nominal wage growth outpaces the CPI, workers experience an increase in real wages and purchasing power. When the CPI rises faster than wages, workers fall behind.
The federal minimum wage offers a clear example of this dynamic. It has been stagnant at $7.25 per hour since 2009. Over that same period, the CPI has steadily risen, meaning the real value of the minimum wage has eroded each year. What $7.25 could buy in 2009 is far more than what it can buy today.
This is why economists and research groups like the Economic Policy Institute (EPI) emphasize that real wage trends provide a much clearer picture of worker prosperity. Nominal wage trends alone can be deceiving, masking the painful effects of inflation spikes or the slow, steady erosion of purchasing power over time.
Frequently Asked Questions
How do you adjust historical wages for inflation?
You adjust historical wages by using the Consumer Price Index (CPI). The formula is to multiply the historical nominal wage by the ratio of the current year’s CPI to the historical year’s CPI. This converts the old salary into its equivalent value in today’s dollars.
Has the average worker’s pay kept up with inflation since the 1950s?
While nominal wages have increased substantially since the 1950s, real wage growth has been much more modest. There have been long periods of stagnation or even decline in real wages, particularly during times of high inflation, meaning pay has not always kept up with the cost of living.
What is the difference between nominal and real wages?
Nominal wages are the actual dollar amount paid to a worker at the time. Real wages are wages that have been adjusted for inflation, reflecting their true purchasing power in terms of what goods and services they can buy.
Have federal minimum wage increases kept up with inflation?
No, they have not. The real value of the federal minimum wage reached its peak in 1968. Since then, its inflation-adjusted value has generally declined, as nominal increases have failed to consistently keep pace with the rising cost of living.
Conclusion
Comparing a salary from decades ago to one today without context is like comparing apples and oranges. By adjusting historical wages for inflation, we can translate past earnings into a language we understand: today’s dollars. This essential process strips away the distorting effects of rising prices, revealing the true history of our economic progress.
Whether you’re a policymaker assessing economic health, a business negotiating fair contracts, or simply a curious individual trying to understand the past, converting nominal wages into real wages is the only way to get an accurate picture. It is fundamental to understanding the true historical value of money and how living standards have evolved over generations.